Can You Use CSS in Tableau Workbooks?
Learn if CSS can be used in Tableau workbooks, and see other methods for customizing visualizations with custom color palettes and fonts.

Tableau and CSS: Is it Possible?
Let’s cut to the chase. If you are wondering if you can leverage your existing CSS to customize your Tableau visualizations when publishing to your website, the answer is no.
While there doesn’t seem to be an “official” statement from Tableau as to why, the Tableau community will report quite clearly and consistently that, “Tableau does not support bringing in custom CSS, JS, or HTML….” A link to a discussion on this topic can be found here.
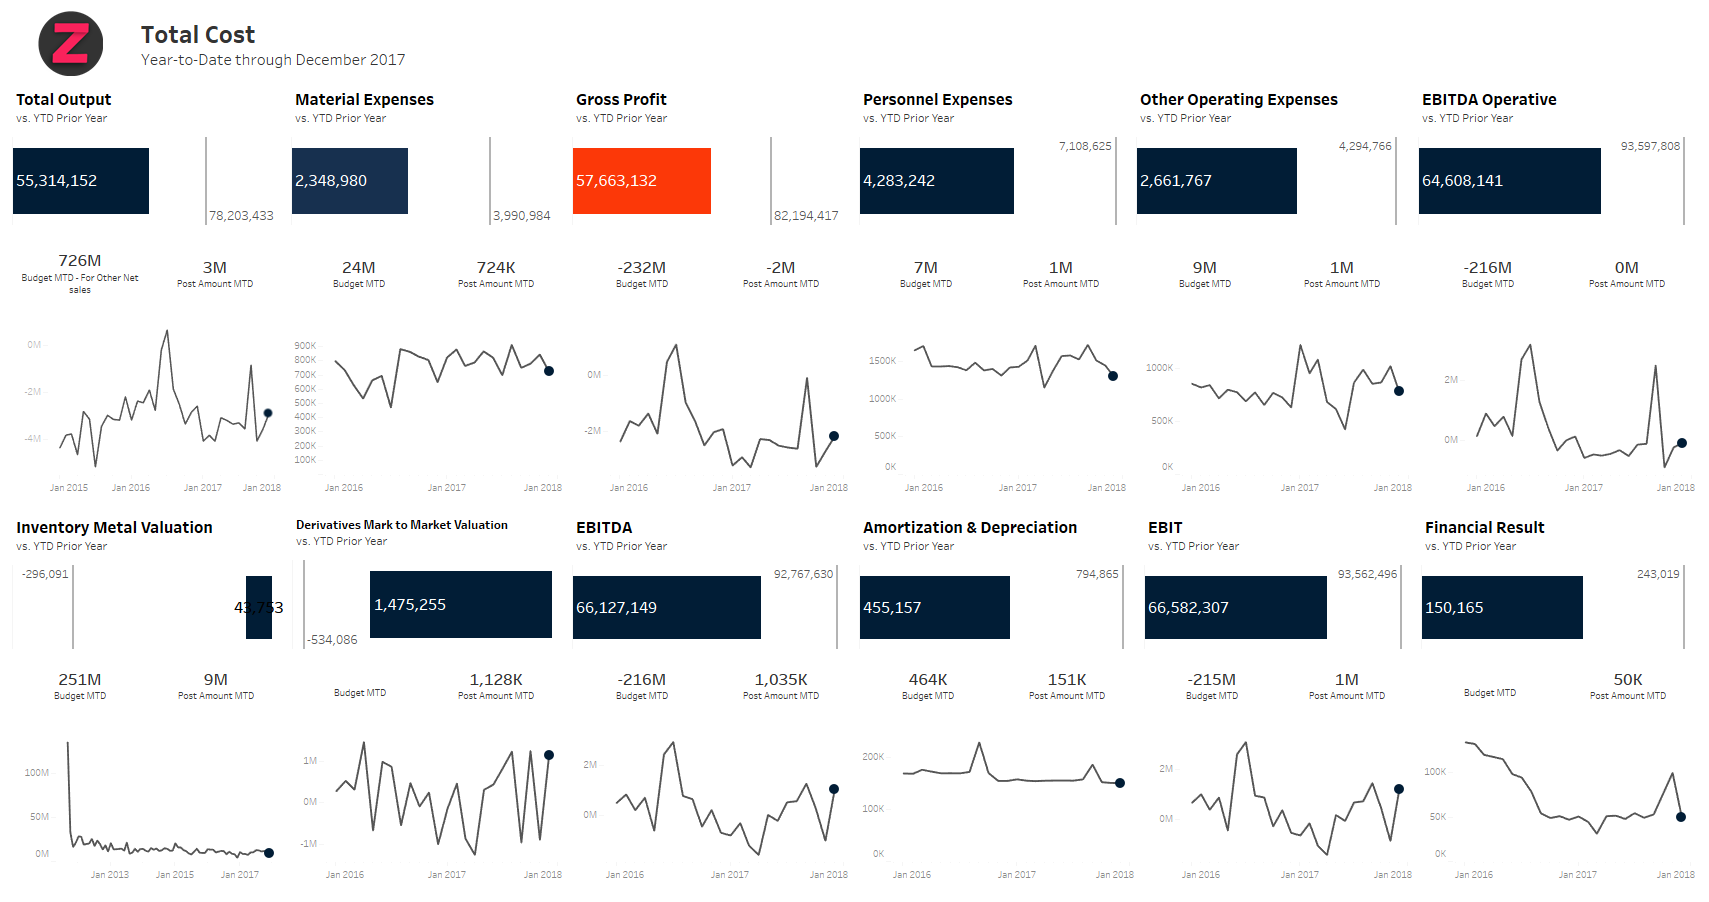
However, there are ways to leverage Tableau’s powerful dashboards and visualizations and still maintain your company’s branding standards.
- Tableau offers a very effective means of embedding a dashboard into a web page with the Tableau JavaScript API.
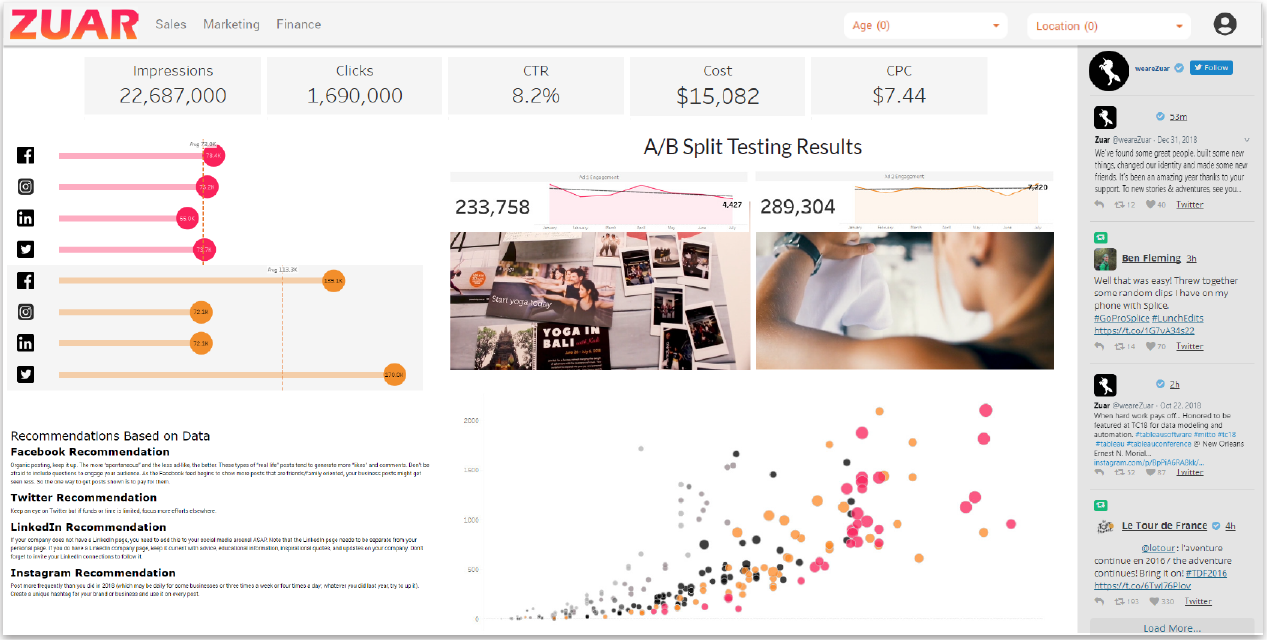
- Zuar Portal provides the ability to present Tableau insights through turnkey, highly customizable, secure web portals.
The JavaScript API provides a deep well of options to control visibility of Tableau components. Tableau also provides the flexibility to implement custom color palettes and install custom fonts.
Using the combination of Tableau font and color customization and the JavaScript API, you can leverage the standards set by your company to provide a “white label” version of the Tableau dashboard that mirrors any CSS-based customization.
Although JavaScript API utilization is beyond the scope of this article, Zuar has provided an excellent webinar on the topic here. This article covers the first steps in getting your Tableau Dashboard ready by leveraging the font and color customization tools.
Related:

Color Customization: Tableau Desktop
Please note that, prior to making changes as mentioned below, it is recommended to close your Tableau Desktop application. Changes made will not apply until Tableau is closed and restarted.
Tableau Dashboard can incorporate and match the exact colors you would like to utilize. In Tableau Desktop, this is something that can be done relatively easily. Tableau Desktop allows the creation of a custom color palette that can be incorporated and referenced in dashboard design.
The creation of the custom color palette is done by updating the Preferences.tps file. This file is found in the home directory’s Documents>My Tableau Repository directory. This is a screenshot of the directory from a Windows Machine.
The Preferences.tps file is an xml file that accepts custom color palettes. Open the file using the editor of your choice for working with xml files. In this screenshot, the file is opened using Notepad.
When the file is opened for the first time, there is very little content. Using the xml tree structure, the first set of tags to add are the preferences tags. The preferences tags are then used to identify and house the custom colors and when those custom colors should be applied.
Inside the preferences tags, the color-palette tags are included to identify the custom color palette. The color-palette provides a few arguments. The first argument, name, identifies the name of the custom color palette.
The type argument defines how or when the color palette can be used. There are three options for the type argument:
1. regular – applies to categorical data
2. ordered-sequential – applies to continuous data
3. ordered-diverging – applies to a diverging range of data
Inside the color-palette tags will be the color tags. The color tags contain the hex values associated with the custom colors you require.
In this example, there are six custom colors. For consistency, the colors are included for each type of color palette. Note that the name will be used later when finding and applying the custom color palette.
After these changes are made, save and close the file.
Proceed to Tableau Desktop and Open the application.
Important: It is worth noting that applying custom colors differ if the data source is Tableau Server. The example below is using data generated from an SQL statement from a PostgreSQL connection.
To apply the custom color palette, select Color in the marks card.
When the dialog box opens, select 'Edit Colors'. In the top right corner, there is a drop-down box that allows for the selection of color palettes.
Here you will find the custom color palette that was created. Recall that the name of the color palette that was created above is 'Zuar Demo'.
After locating the custom color palette, select 'Assign Palette' and 'Apply/OK'. Now your custom color palette is accessible.

Installing & Using Custom Fonts
If your company or brand uses custom fonts, they can also be incorporated into your Tableau Dashboard. However, there are some things to consider. For example, leveraging custom fonts differs if you are using Tableau Server versus Tableau Desktop.
Tableau Server requires the font to be installed on all nodes of the server. It is also worth noting that workbooks downloaded from Tableau Server will not retain the custom fonts. A link reviewing all the considerations when leveraging custom fonts with Tableau server can be found here.
If Tableau Desktop is to be used, then the process is less involved. The first requirement is to install the custom font on to your machine. Here are links to installing custom fonts for Windows and Mac.
In this example, I downloaded a custom font and installed it as described in the link above. I opened my Tableau Desktop. In this screenshot, the default Tableau font is being used.
Using the formatting options, changing the existing font to a custom font is no different than selecting any other font that came installed with Tableau.
Let's change the title in this visualization. Select 'Format'>'Font' and change the font for the title to the custom font. The results are seen below.
Publishing dashboards when using Tableau Desktop does not require any further consideration. As stated before, leveraging custom fonts when publishing from Tableau Server does require more work.
This Tableau article provides a nice overview of the conditions and considerations required based on the type of Tableau application you are using.
Learn more about customizing Tableau dashboards such as adding drop shadows or fixing dashboard sizes.

Implementing Data Portals
For a more robust and flexible solution, consider implementing a data portal. What is a data portal? It's a web application, website, or page of a website that holds data from different sources, organized under subsets or categories to make it simple for users of the site to find what they are looking for.
This solution allows your organization to create curated analytics experiences for all their customers, whether they're internal or external. Modern data portals such as Zuar Portal provides deep customization functionality and quick set-up. This makes it is easy to incorporate your company's branding (whether it be colors, font, logos, etc.) into all your Tableau dashboards.
Create an intuitive and guided experience that makes it easy to rapidly obtain accurate business intelligence on any device - whether that be a smartphone, computer, or tablet.

Moving Forward
Finding the most efficient way of creating customized Tableau dashboards is not always an easy task. As one of the top Tableau consultancies in the world, Zuar's team has deep knowledge and experience with creating customized BI visualizations and embedding Tableau dashboards in websites.
Learn more about Zuar's Tableau consulting services:

If you think data portals could be a good fit for your organization, we'd love to sit down with you for a free data strategy assessment, and set you up with a free Zuar Portal demo and trial.


