What Is a KPI Dashboard? Benefits & Examples
Learn what a KPI dashboard is, the benefits it can bring to your business, the types of KPI dashboards, and how to implement them.


What Is a KPI Dashboard?
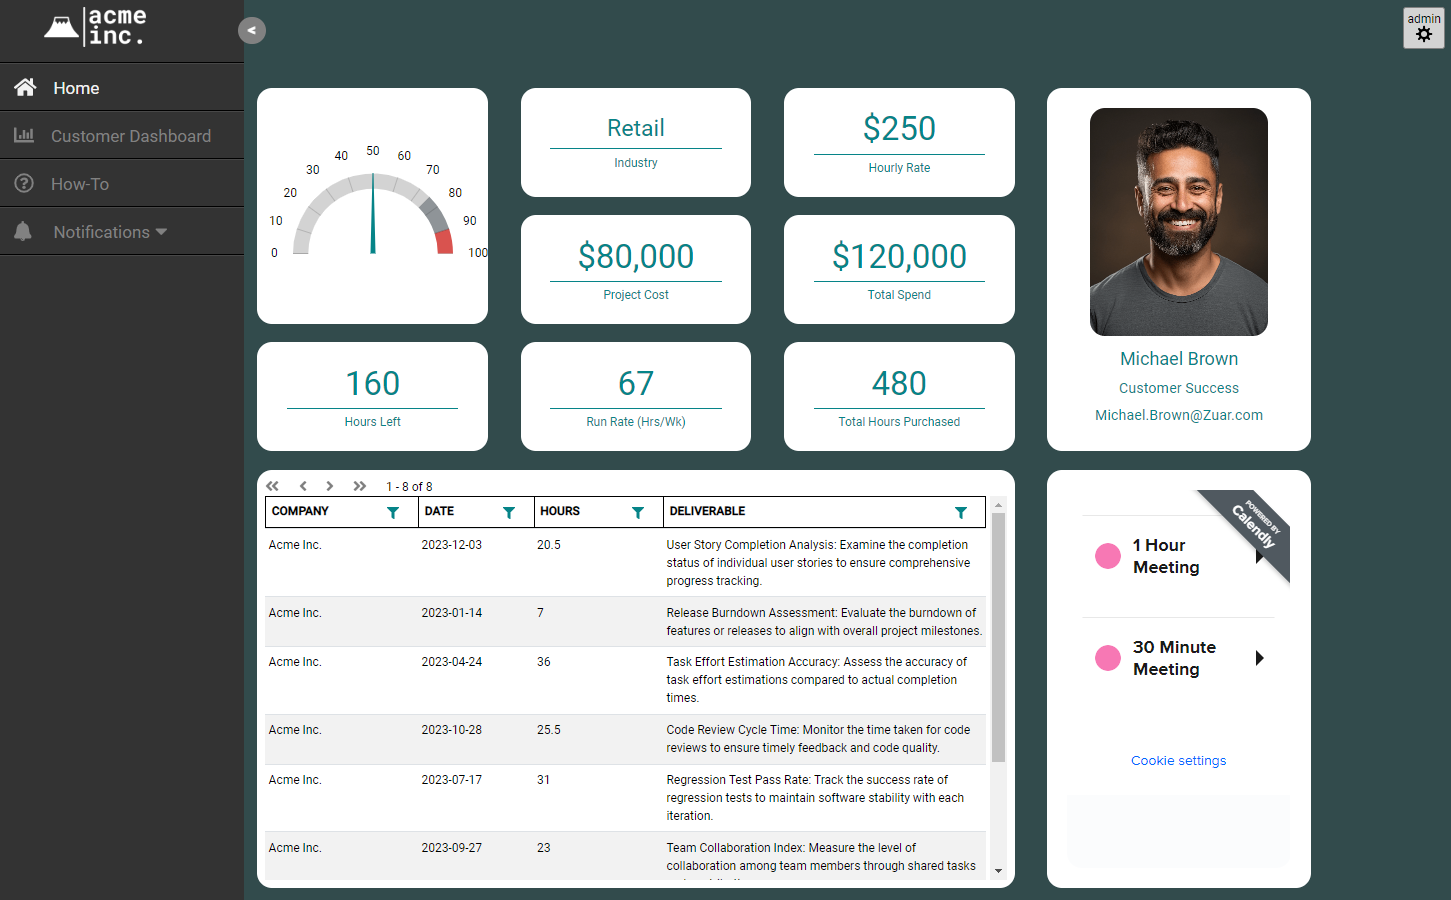
A KPI dashboard is a data visualization tool that displays the most important key performance indicators (KPIs) for an organization or department. It provides an at-a-glance view of performance metrics that enable data-driven decision-making.
A KPI dashboard consolidates various KPIs into one central location and presents the data in easy-to-understand visual formats like charts, graphs, and gauges. This allows users to quickly analyze trends, compare values, and identify issues or opportunities.
More advanced dashboards can be interactive, allowing users to drill down into the data for more context and filter the display for specific parameters.
A well-designed KPI dashboard aligns to organizational goals and strategies. It focuses on the vital few KPIs that offer the greatest business impact and signals whether outcomes are aligned to targets.
The dashboard updates in real-time or near real-time to provide an accurate picture of business performance. This enables rapid course correction when needed.
Key Takeaways
- KPI dashboards visualize key metrics in charts and graphs to track progress on goals, spot problems, and guide data-driven decisions.
- Effective KPI dashboards are customized, contextualized, connected to live data, and keep the number of KPIs small.
- Platforms like Zuar help build real-time, interactive dashboards that provide actionable insights to boost performance.
What Are KPIs?
A key performance indicator (KPI) is a measurable value that demonstrates how effectively a company is achieving key business objectives. Organizations use KPI software to evaluate their success at reaching targets.
KPIs reports vary between companies and industries, depending on their priorities. Common examples of KPIs include:
- Sales revenue
- Customer churn rates
- Customer acquisition cost
- Website traffic
- Employee turnover
- Operating costs
- Return on investment
KPIs are quantifiable measurements, usually presented as a number or percentage. For example, a retail clothing store might have a KPI of a 20% increase in annual sales.
Data for KPIs is extracted from an organization's CRM, financial reporting, web analytics, HR information system, and other data sources. The measurements are then compared over time to gauge performance improvements or declines.
By tracking KPIs, companies can determine how well they are performing against strategic goals. KPIs enable businesses to make data-driven decisions to meet objectives. They provide a way to evaluate success and identify areas for improvement.
Related Article:
 Team Zuar

Benefits of KPI Dashboards
KPI dashboards provide organizations with numerous benefits that can improve performance across departments and teams. Here are some of the key advantages of using KPI dashboards:
Track Progress Towards Goals
One of the most important benefits of KPI dashboards is the ability to track progress towards organizational, departmental, and team goals.
By defining relevant KPIs and monitoring them on a dashboard, you gain clear visibility into whether you are on track to hit your targets or if adjustments need to be made. This allows you to course correct in a timely manner instead of waiting until the end of a period to analyze results.
Identify Areas for Improvement
In addition to tracking goal progress, KPI dashboards make it easy to pinpoint specific areas that need improvement. If certain KPIs are lagging behind expectations, you can dig into the details to uncover the root causes.
This insight allows you to develop targeted solutions to boost performance rather than taking a broad guessing approach. Frequent monitoring of KPIs leads to faster identification and resolution of problems.
Increase Efficiency
With a data-driven approach provided by KPI dashboards, teams can identify redundancies and bottlenecks that affect productivity. By spotlighting inefficient processes through KPI tracking and analysis, organizations can streamline workflows, reduce waste, and maximize output.
This leads to improved utilization of resources, lower costs, and optimized operations across units. The visibility provided by KPI dashboards is key for unlocking efficiency gains.

Types of KPIs
KPIs can be categorized in several different ways, including:
Leading vs Lagging Indicators
- Leading indicators are KPIs that can predict future performance. For example, customer satisfaction scores may indicate future revenue trends.
- Lagging indicators are KPIs that show the result of past activities. Sales revenue is a lagging indicator, as it shows revenue that has already been generated.
Leading indicators are useful for forecasting and planning, while lagging indicators show the outcomes of previous actions. A good KPI dashboard includes both leading and lagging metrics.
Quantitative vs Qualitative
- Quantitative KPIs are numeric metrics that can be measured and quantified. Examples include revenue, costs, conversion rates, etc.
- Qualitative KPIs are based on subjective qualities that can be observed but not directly measured. Examples include customer satisfaction, brand awareness, employee engagement, etc.
A quantitative KPI report provides concrete data points, while qualitative KPIs add context around customer and employee perceptions.
Input vs Output KPIs
- Input KPIs measure activities that contribute to future performance. For example, marketing spend is an input KPI, as that spend will drive future activities.
- Output KPIs measure the results of past efforts. Revenue and sales numbers are output KPIs that show the outcomes already achieved.
Input KPIs indicate efforts that should lead to results, while output KPIs measure the actual results achieved. Linking input and output KPIs together can show the effectiveness of activities in driving desired outcomes.

KPI Dashboard Examples
KPI dashboards can vary significantly depending on the department or function they are designed for. Here are some common examples with a variety of example dashboard styles:
Sales Dashboard
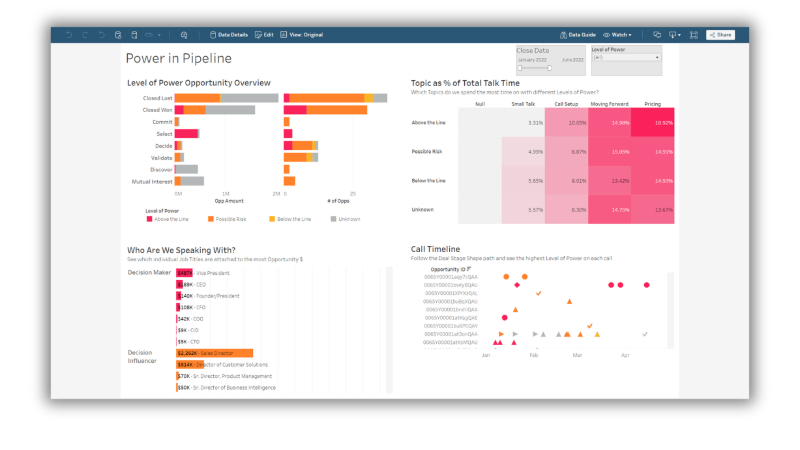
A sales dashboard tracks KPIs like monthly recurring revenue, sales quota attainment, lead conversion rates, and sales cycle length. It provides visibility into sales performance and identifies opportunities for improvement.
Sales teams can quickly see their progress towards goals and adjust strategies as needed based on real-time data.
Marketing Dashboard
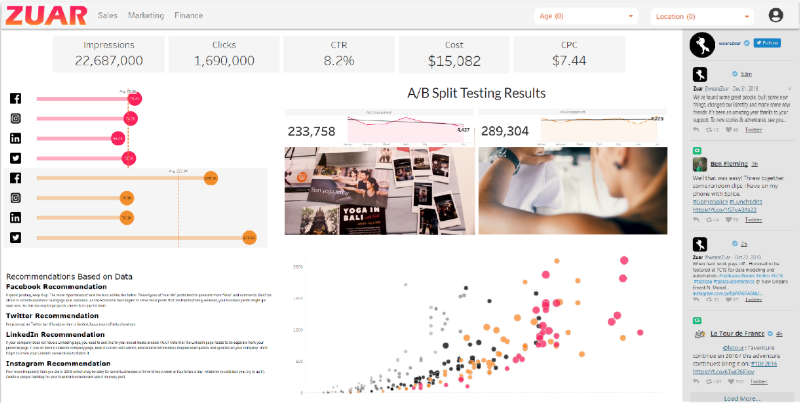
Marketing dashboards help teams gauge campaign effectiveness and return on marketing investment.
Typical marketing KPIs include website traffic, leads generated, search engine rankings, social media engagement, email open rates, and cost per lead. Marketing dashboards enable data-driven decisions about where to allocate budget and resources.
Finance Dashboard
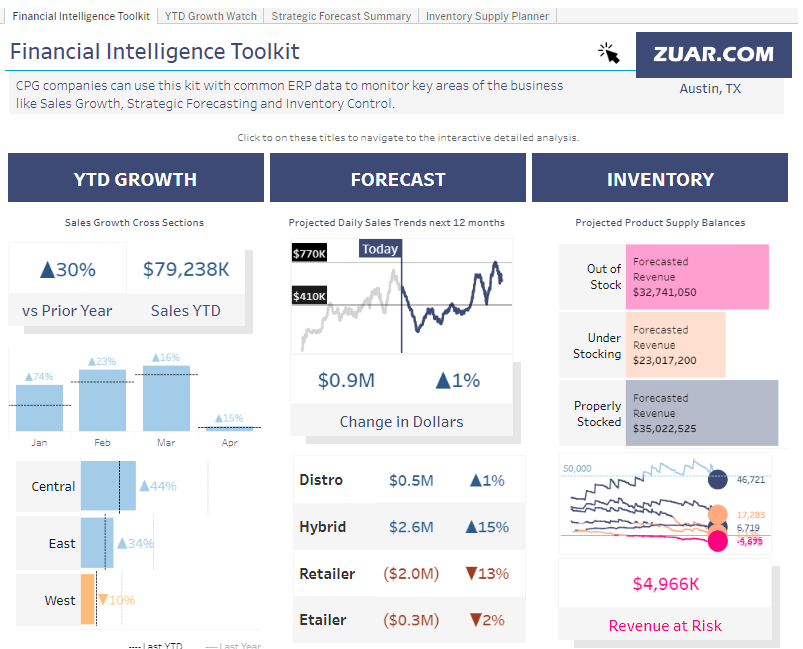
A financial dashboard is essential for tracking a company's financial health and performance. It aggregates key financial metrics and KPIs such as revenue, expenses, cash flow, profit margins, EBITDA (Earnings Before Interest, Taxes, Depreciation, and Amortization), and return on investment (ROI).
This dashboard serves as a central point for monitoring financial results against forecasts and budgets, allowing for timely adjustments in financial strategies.
It helps in understanding the financial impact of various operational activities, guiding decision-making for investments, cost management, and funding strategies.
Support Dashboard
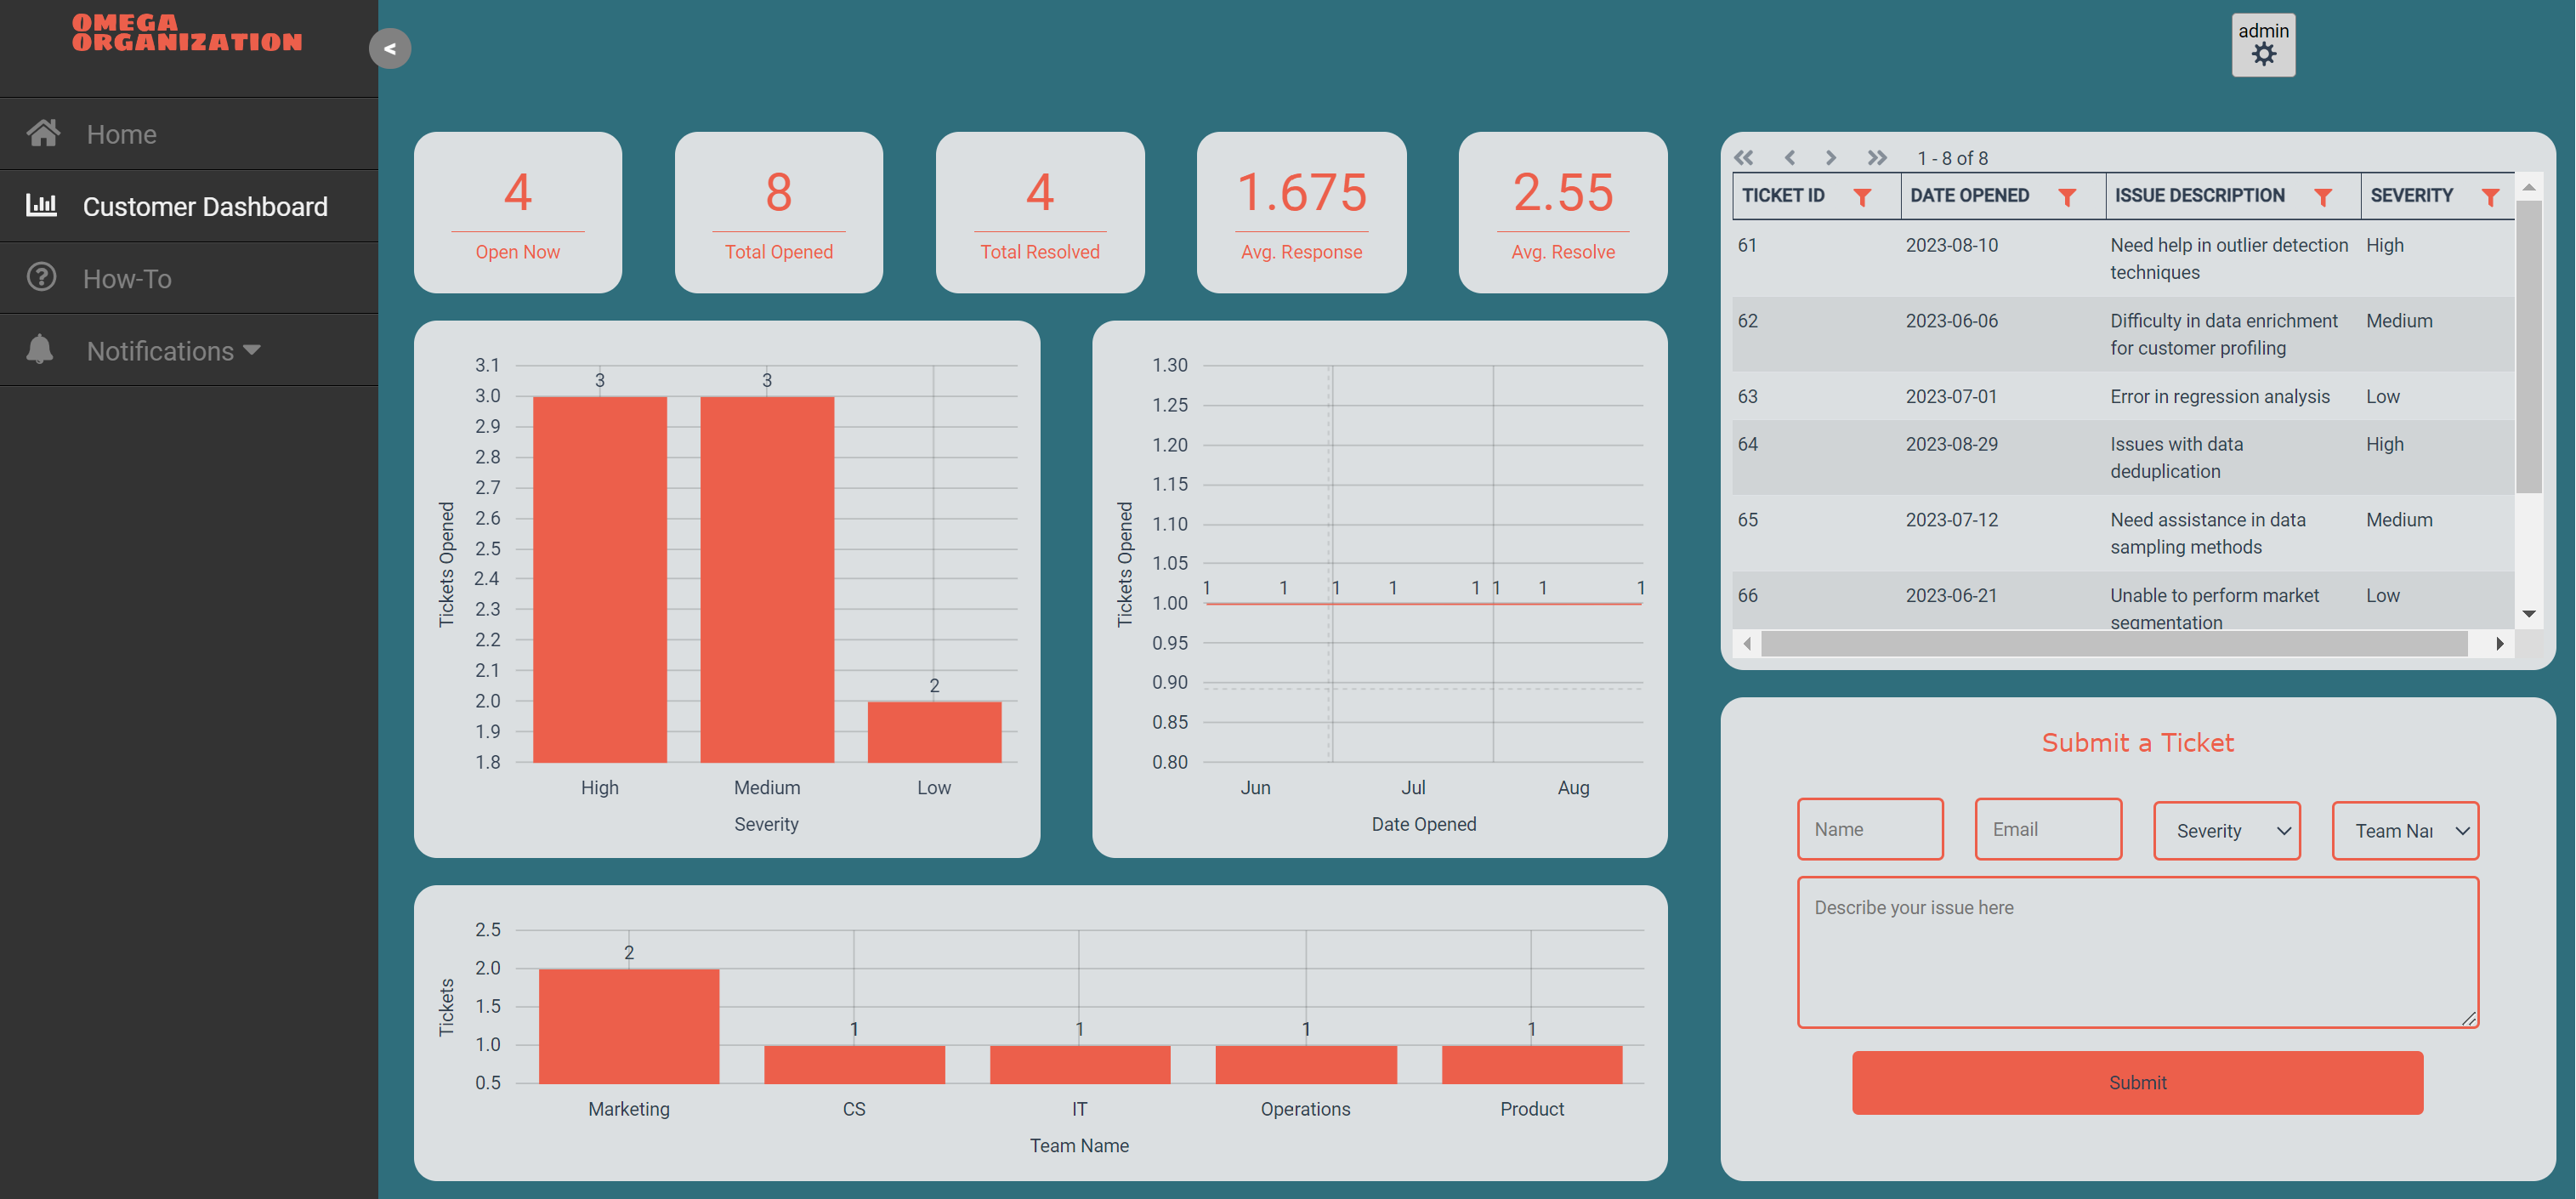
Support teams rely on KPI dashboards to monitor metrics like customer satisfaction (CSAT) scores, first contact resolution rates, average response time, wait times, and ticket volumes.
By tracking support KPIs, teams can quickly identify issues and trends so they can improve customer service. Support dashboards may also track team productivity, such as cases handled per agent.
KPI dashboards are customized to the specific department and objectives. But in any case, they provide data-driven insights to help teams work smarter towards shared goals. The visibility and focus KPI dashboards enable are key to improving overall performance.

KPI Best Practices
When implementing KPI dashboards, it's important to follow best practices to ensure they are effective. Here are some key tips:
Limit the Number of KPIs - Only include the most critical KPIs - too many will dilute focus. Stick to 5-10 key metrics that align to strategic goals. Trying to track too many KPIs can lead to data overload.
Consider Your Audience - Tailor the KPI dashboard to your audience. Frontline workers may need different metrics than executives. Ensure the data presented makes sense for who will be using the dashboard, whether they are technical or non-technical users.
Automate Data Inputs - Automate data flows into the dashboard to ensure efficiency. Manual data entry is time-consuming and prone to errors. Connect data sources to auto-populate the dashboard.
Provide Context for KPIs - Don't just report the metrics, provide context. Add targets, benchmarks, and trendlines to give perspective. Commentary can explain why KPIs are up or down. Context turns raw data into meaningful, actionable insights.

Common KPI Dashboard Mistakes
Organizations often make mistakes when implementing KPI dashboards and metrics. Some common pitfalls to avoid include:
- Too Many KPIs - Tracking too many KPIs can lead to data overload and lack of focus. Most experts recommend limiting KPI dashboards to 5-10 key metrics aligned to strategic goals.
- KPIs Not Aligned to Strategy - KPIs should directly measure progress on strategic business objectives. Metrics not tied to strategy provide little value. Ensure your KPIs track goals like revenue growth, customer satisfaction, quality, efficiency etc.
- Lack of Buy-In - Getting stakeholder and employee buy-in is crucial. KPIs should resonate with your teams. Lack of buy-in leads to lack of adoption. Involve leadership and representatives from different departments in defining KPIs.
- Not Reviewing KPIs Regularly - KPIs must be periodically reviewed and refreshed. Things change - strategies pivot, markets fluctuate. Review KPIs quarterly or bi-annually to ensure they remain relevant. Retire or replace stale KPIs that no longer provide value.

Implementing KPI Dashboards With Zuar
When it comes to KPI dashboard software, Zuar has you covered. Zuar provides a powerful and flexible platform for building customized KPI dashboards tailored to your business needs. With Zuar, you can easily track the metrics that matter most and gain actionable insights into your operations.
Zuar Portal offers a drag-and-drop interface that makes it simple to build interactive dashboards with the visuals and layout you want. Drill-downs allow you to click into the data for more granular analysis.
You can build dashboards and KPI reports with standard web development skills like HTML and JavaScript. Click here to start a free trial of Zuar Portal!
Zuar Runner connects directly to your data sources like databases, cloud applications, and APIs to feed live data into the dashboards. It handles all the complexity behind fetching, transforming, and caching the data. This enables real-time dashboards that accurately reflect the latest business metrics.
Overall, Zuar provides a full-featured platform for building interactive KPI dashboards customized to your needs, enabling data-driven decision-making and performance management. Its flexibility and connectivity make it easy to build effective dashboards that deliver strategic insights.
With our team of data experts, we can help you create KPIs that align with your unique business goals, choose the best data visualizations to include in your dashboards, set up an automated data pipeline to feed data into those dashboards, and enable your team.
Learn how you can fast-track your KPIs dashboards by talking with one of our friendly data experts:
Team Zuar Team Zuar